Make a Plot of Historical Data
Nov 24, 2022 · Python
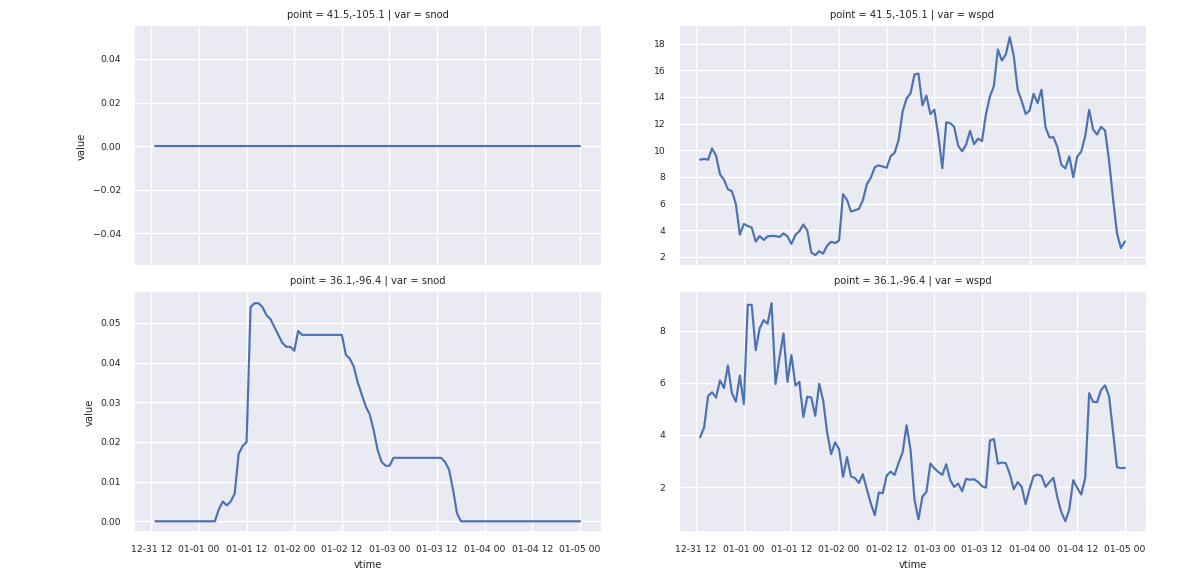
This example will pull a chunk of historical data for two points as a netcdf file, open it with xarray and plot the snod and wspd variables using pandas and seaborn. The goal of this example is to demonstrate how easy it is to pull continuous time series data. This example also shows how our data is ready to be used with xarray/pandas/seaborn which are common data science tools that readers may be familiar with.
Python
import xarray as xr
import pandas as pd
import seaborn as sns
import matplotlib.pyplot as plt
import requests

sns.set(font_scale=0.6)

MYRADAR_API_KEY = "YOUR_KEY"
headers = {
  "Subscription-Key":MYRADAR_API_KEY
}

url = f"https://api.myradar.dev/v1/timeseries/hist/20230401.0000/20230404.0000?latlons=[[41.5,-105.1],[36.1,-96.4]]"

out_fname = "data.nc"

c = requests.get(url, headers=headers)
with open(out_fname,"wb") as f:
    f.write(c.content)

ds = xr.open_dataset(out_fname)
df = ds.to_dataframe()

_df = df.reset_index()
_df = _df.melt(id_vars=['point','vtime','var'],value_vars=['data'])
_df = _df.loc[(_df['var'] == 'snod') | (_df['var'] == 'wspd')]

_df['vtime'] = pd.to_datetime(_df['vtime']*1e9)

g = sns.FacetGrid(_df, col='var', row='point', sharey=False)
g.map(sns.lineplot, 'vtime', 'value')
plt.show()