


Get a Route Forecast from a Trimble Maps Response
Add weather to Trimble Maps Routes
Given a Trimble Maps route response like the example provided in trimble_route_response.json, make a request for forecast data and then plot the road condition colors along the route path in a cartopy map.
import matplotlib.pyplot as plt
import requests
import json
import numpy as np
import polyline
from cartopy.io.img_tiles import OSM
import cartopy.crs as ccrs

MYRADAR_API_KEY = "YOUR_KEY"

with open("trimble_route_response.json","rt") as f:
    trimble_route_obj = json.loads(f.read())

depart_time = "20230422.1200"

url = f"https://api.myradar.dev/v1/timeseries/trimble_route?depart_time={depart_time}"

headers = {
    "Subscription-Key":MYRADAR_API_KEY
    }


c = requests.post(url, json=trimble_route_obj, headers=headers) # make a request

route_data = c.json()
route_fcst = route_data['routes'][0]
road_condition_colors = route_fcst['rc_colors']

latlons = polyline.decode(route_fcst['points'])
lonlats = np.array([[lon, lat] for lat,lon in latlons])
minx = np.min(lonlats[:,0])
maxx = np.max(lonlats[:,0])
miny = np.min(lonlats[:,1])
maxy = np.max(lonlats[:,1])

imagery = OSM()
ax = plt.axes(projection=imagery.crs)
buff = 2.5
bounds = (minx - buff, maxx + buff, miny - buff, maxy + buff)
print(bounds)
ax.set_extent(bounds)
zoom = 6
ax.add_image(imagery, zoom)

for i in range(len(lonlats)):
    plt.plot(lonlats[i,0], lonlats[i,1], marker='.', color=road_condition_colors[i], markersize=2, transform=ccrs.PlateCarree())

plt.show()
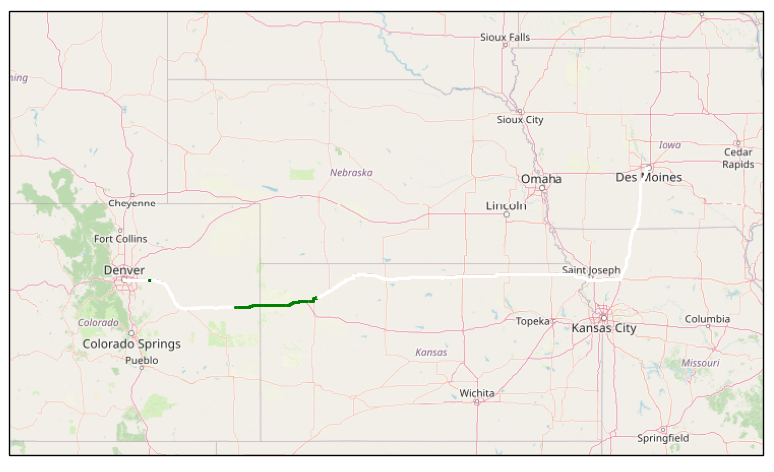
You should see a map similar to the below picture. In this route, assuming you haven't changed the departure time from the example above, you should see a green section along the route indicating wet road conditions.