


Build a Power Prediction Model
Using power production data from Texas wind farms (http://www.ercot.com/gridinfo/load/load_hist/), lookup historical wind speed data and train a power prediction model. This example shows how the data downloaded from our API is ready to be used in a Machine Learning scenario with very little effort.
The data file required can be downloaded here: Native_Load_2023.csv
First import all the tools we will need, these should be available through pip or conda:
import xarray as xr
import pandas as pd
import statsmodels.api as sm
import requests
import numpy as np
Next make a HTTP request to our API using a begin time and end time for one point, download the results and save to a temp file, open the temp file as netcdf:
# notice the timestamps in the URL, pulling one month of data

MYRADAR_API_KEY = "YOUR_KEY"
headers = {
  "Subscription-Key":MYRADAR_API_KEY
}

url = f"https://api.myradar.dev/v1/timeseries/hist/20230301.0000/20230401.0000?latlons=[[32.901,-97.039]]"
out_fname = "data.nc"
c = requests.get(url, headers=headers)
with open(out_fname,"wb") as f:
    f.write(c.content)

ds = xr.open_dataset(out_fname)
data = ds.variables['data'].values
Convert the valid times to pandas timestamp:
vtimes = pd.to_datetime(ds.variables['vtime'].values*1e9)
Load in power production data downloaded from ERCOT website, then fix the timestamps on this dataset:
df = pd.read_csv("Native_Load_2023.csv") #load texas power data

#need to fix their weird timestamps
df['hr'] = df['Hour Ending'].str.slice(11,13)
df['day'] = df['Hour Ending'].str.slice(0,10)
df['ihr'] = df['hr'].astype(int)
df['ihr'] = [f'{i:02d}' for i in (df['ihr'] - 1)]
df['time_str'] = df['day'].str.cat(df['ihr'])
df['time'] = pd.to_datetime(df['time_str'], format='%m/%d/%Y%H')
Because the endpoint supports multiple points but we provided only one, the 'point' dimension has length 1, the 'var' dimension we grab the last one because that is wspd:
dfw_data = data[-1,-1,:] #gives us wspd time series for the one point
dfw_data = np.array([dfw_data, vtimes]) #put it with the valid times
dfw_data = np.rollaxis(dfw_data, 1, 0) #rotate the array to be in pandas row format
dfw_df = pd.DataFrame(dfw_data, columns=['wspd','time']) #make a new dataframe with 'time' column for joining with obs
Now match the downloaded historical data with the observations based on time column, pull out the predictor (wspd) and predictand (NORTH power production):
match = pd.merge_asof(dfw_df, df, on='time') #match observations with forecast based on time
match = match.dropna() #clean up empty
X = match["wspd"].astype(float)
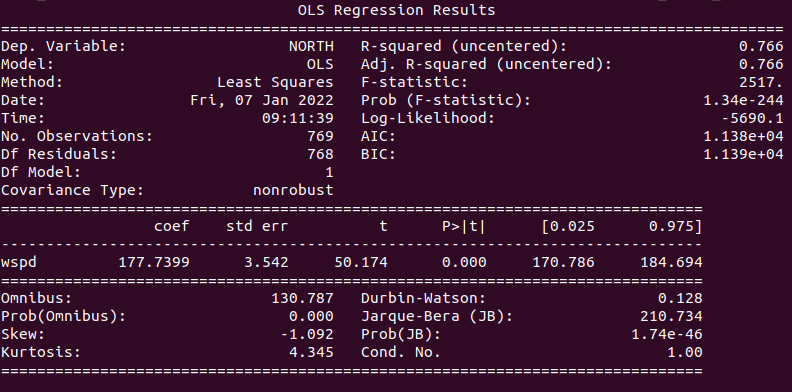
y = match["NORTH"].astype(float)Finally the matched data can be used to train a regression model and print the results:
model = sm.OLS(y, X).fit()
predictions = model.predict(X)

print(model.summary())